
The Data
The story that I wanted to tell with the data that I collected was, how much do psychology students differ from digital study students grade wise. The reason why I picked these two fields is because they both relate to me as I’m a psychology major with a minor in digital studies. Embedded in this post will be the spread sheet I created titled, Psychology vs Digital Studies Grades. Attached below are the two column graphs I developed with my data

(The total rate in which psychology students either obtained an A, B, C, D, or F)
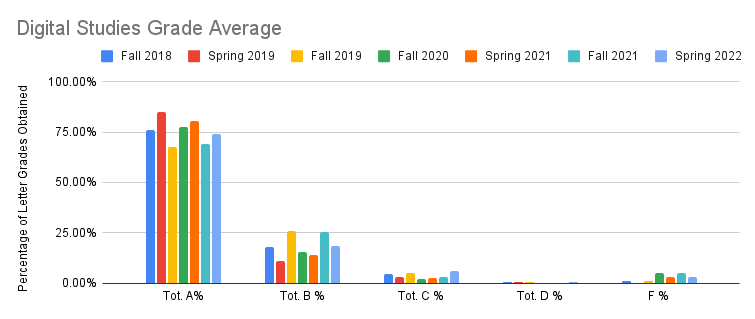
(The total rate in which digital studies students either obtained an A, B, C, D, or F)
The Story
The story as I said in my data section was, to examine the commonalities and differences that psychology and digital studies share when comparing their total number of letter grades. A couple things to take into account that will help give some context to this story is the missing data for Spring 2020. This semester is when the COVID-19 pandemic was still at large resulting in grade changes. Another thing is the percentage rate of letter grades. While they are both very different percentage rates (Psychology’s highest being 60% while digital studies is 100.00%) this is due to the number of students in the department. Psychology on average has a bit over 1,000 students while digital studies has on average around 100-180 students).
Psychology Students
Let’s first start with the psychology students. During the pre-COVID-19 semesters, which are the Fall 2018, Spring 2019, and Fall 2019 semesters, we can see that were wasn’t much variation with grade percentages. There are some notable features like, the Fall 2018 semester having the total number of B’s being the highest rated grade achieved, then having the total number of A’s be rated the highest in the Spring and Fall semester of 2019. Another interesting note was how the rate of F’s were significantly lower in the 2019 Fall semester compared to the Fall 2018 and Spring 2019 semesters, inferring that more psychology students are trying taking their work seriously.
When we move into the second semester, we can see this story really take off as the rate in which psychology students got a total number of A’s skyrocketed in the Fall 2020 and Spring 2021 semester. We can infer that this massive increase happened because of how in person lectures, exams, and work all got moved online. This of course opened the doors for students to use whatever resources they had available to them on the Internet to help with their studies. This door being opened also causes some trouble however, as students also now have the resources to cheat on exams or quizzes since they could easily find their answers online, boosting up their grade. Some more evidence for this claim can be found at the D and F percentage rate during the Fall 2020. The total F percentage rate from the Fall 2020 semester has risen greatly from the total F percentage rate in the Fall 2019 semester, while the total D percentage rate is almost non existent in the Fall 2020 semester. This is probably from professors finding out when students have cheated on exam or quiz and quickly gave them a zero, making it much easier to achieve than a D.
When looking at the Fall 2021 and Spring 2022 total semester letter grade averages, we can see things begin to level out and not be extreme in scores. While the total number of A’s still tower over all of the total number of the other letter grades, it’s barley passed 40%. This is probably due to UMW returning back to a new normal when COVID began to die down, this would see some class being hybrid with their material. Some professors would have in-person lectures with work or exams being done all online while others would do an all asynchronous class. Having some major exams, work, or quizzes still being done online is probably what contributed to the total number of A’s still taking the lead in the following semesters. Overall, in this story we can see that psychology students benefited majorly from having the Fall 2020 and Spring 2021 semester moved all online.
Digital Studies
Now let’s move on to the digital studies students. Now this column graph is formatted a bit differently, but I still should be able to get my story across. During the Fall 2018, Spring 2019, and Fall 2019 semesters, we can see a good fluctuation between the total number of letter grades obtained, especially in the A column. In this column we can see that for digital study student’s the highest total number of A’s was achieved in the Spring 2019 semester, while the lowest total number of A’s was achieved in the Fall 2019 semester. In this Fall 2019 semester, we can also see the total number of B’s have a big increase, but not big enough to take over the lead of the A’s. The only inference I can make is that, the Fall 2019 semester was when COVID made its first steps and the slow change may affected some of the students and their work.
Moving on to the COVID semesters of Fall 2020 and Spring 2021, we can see that the shift to online school has benefited the digital studies students, especially in the Fall 2020 semester as their total number of A’s has boosted up significantly. When looking at the 2021 Spring semester, we can still see the benefits on online school affect the total number of A’s digital studies students get as their total of A’s is a bit higher than their total in the Fall 2020 semester. With this however, we can see the rise of F’s during this period like the psychology students. In the Fall 2020 semester, we can see the total number of F’s slight increase possibly due to students getting caught cheating. While it does trickle down in the Spring 2021 semester, it is still noticeable.
Moving on to the post COVID semesters of Fall 2021 and Spring 2022, we can see that digital studies students are having a difficult time adjusting back to the UMW campus and classes. The total number of A’s in both semesters have dropped signficantly, with both semesters having the lowest percentage numbers. With this we can see the total number of B’s begin to increase in these two semesters, with the Spring 2022 semester having the highest percentage of total number of C’s. The total number of F’s also begin to make a small increase during these two semesters too, with Fall 2021 having the highest rated. The only reason why I can infer that this sudden small regression happened is because of limited it was to use some of the electronic resources provided by UMW during the post COVID semesters. This was done so UMW could help in preventing the spread of COVID during these semesters. However despite this sour sounding ending. Digital study students still report a mostly A average throughout every semester.
Overall, both of these data sets have a combination of different factors and reasoning about how psychology and digital study students grades were before, during, and after the COVID- 19 pandemic. What both of these stories have in common though is how psychology and digital study students did benefit from the move to online classes during the COVID-19 semesters, and while their grades did dip down after this period, they were still able to keep the total number of A’s high and afloat.
The Process of Telling This Story
If I’m going to be honest, the process of telling these two stories were difficult but very rewarding. Before this project, I never used a google excel sheet, so navigating throughout the data when copying it from the UMW grade distribution was confusing at first. This was mainly due to not knowing what to clean up data related. After going to a couple of the DGST classes and having it explained during class helped make this process of cleaning up data easier. When I got my data cleaned up and made my pivot table, the chart making gave me some problems. While I was able to design what I wanted for my psychology chart, I wasn’t able to with my digital studies chart. Instead of having the semester terms on the bottom of the axis, it put the total grades at the bottom, throwing me for a loop for a bit. After looking over it and cleaning it up however, I was able to understand what the chart was showing and how to interpret it for my story. The story making process of this was interesting as it was fun to infer why the data showed up the way it did. While some obvious one like the affects of COVID was noticeable, others weren’t until given a good look into like the total rate of F’s.